To answer the question of how to read a harmonic spectrum, start by treating a spectrum as a map of current by frequency, not as a single distortion score. Before selecting an active harmonic filter (AHF), identify which harmonic orders carry meaningful amperes, where they were measured, how they change with load, and what residual level is required at the acceptance point. Then calculate the compensating current order by order and verify the result against the AHF’s supported spectrum, CT arrangement, current rating, and site conditions.
This measurement-first approach prevents a common error: converting one THDi percentage directly into an AHF rating. The percentage alone cannot show whether the problem is a dominant 5th harmonic, triplen current in a neutral, a broad spectrum from mixed loads, or simply a small fundamental-current denominator during light load.
Knowing how to read a harmonic spectrum means working in harmonic amperes as well as percentages. Confirm the fundamental frequency, measurement point, load state, phase data, and recording period. Identify the dominant orders and calculate their root-sum-square current. Compare the measured current with the permitted residual at the same location. The difference is the minimum compensation duty, before allowances for load variation, phase imbalance, ambient derating, future expansion, and any reactive-current function.
Do not select an AHF from THDi alone. First measure representative operating states; then define the target; finally confirm that the proposed AHF can inject the required current at the relevant orders without exceeding its continuous rating.
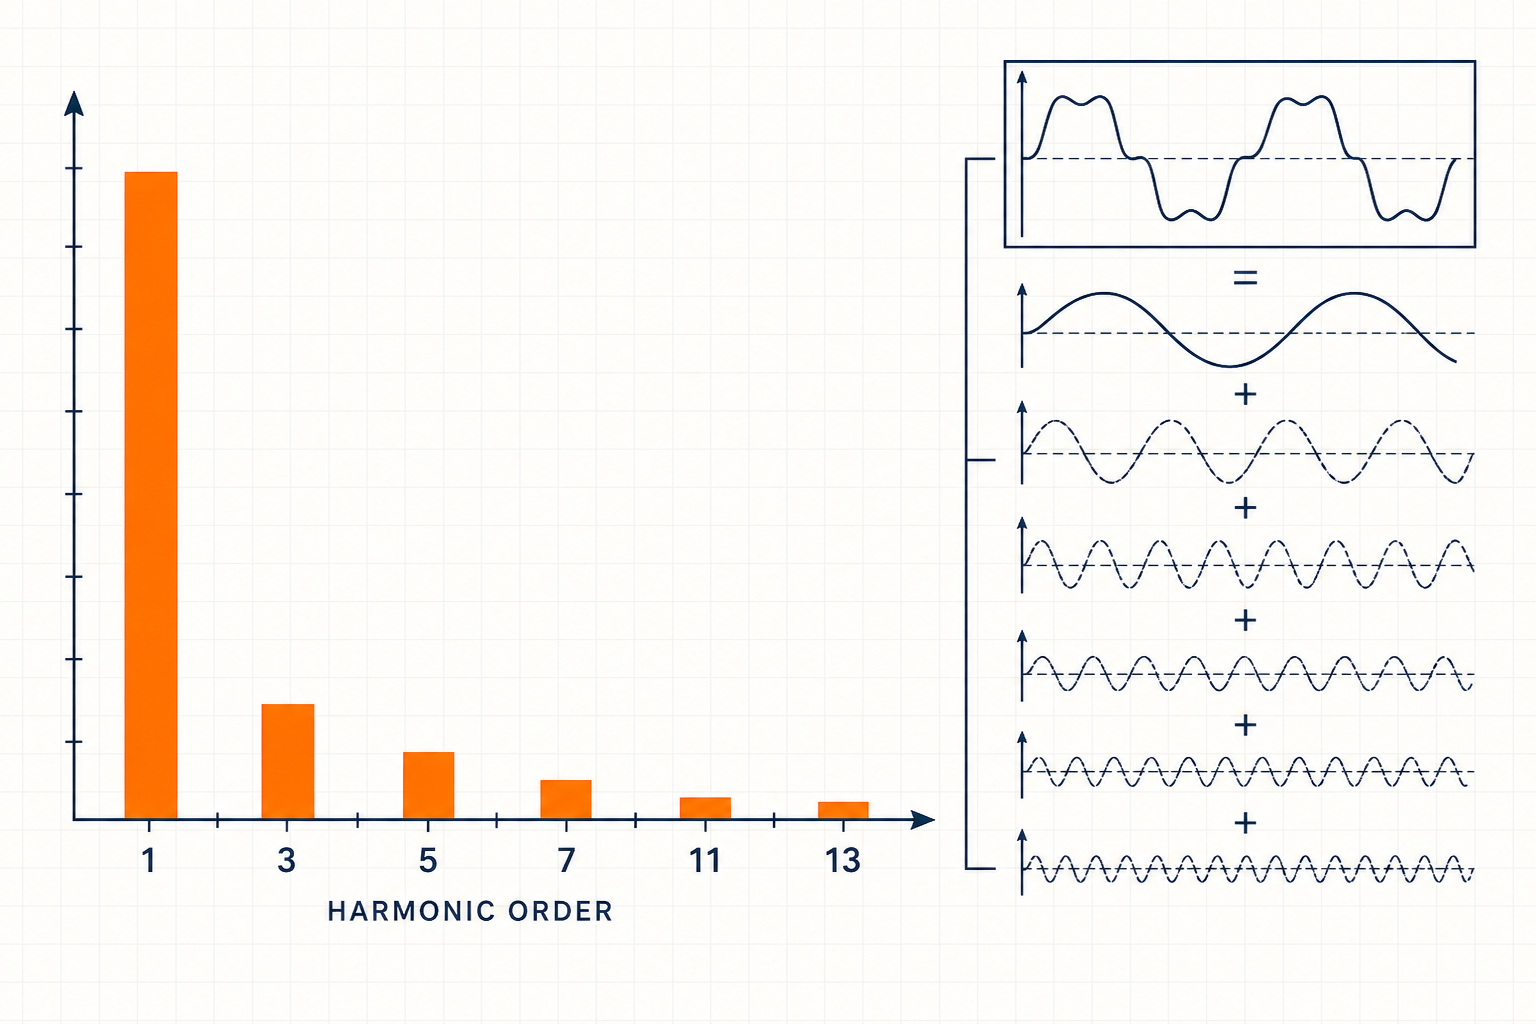
A spectrum separates a waveform into frequency components. On a 50 Hz system, the 5th harmonic is 250 Hz and the 7th is 350 Hz; on a 60 Hz system, they are 300 Hz and 420 Hz. The horizontal axis normally shows order; the vertical axis may show amperes, volts, or percentage. Verify both axes and the reference.
For AHF selection, amperes matter because the converter injects current. A percentage still describes waveform shape, but 20% of 50 A differs from 20% of 500 A. Check whether values are per phase, averaged, maximum, or aggregated. Save timestamped spectra with operating notes rather than relying on a snapshot.
[image: A portable three-phase power-quality analyzer connected at a low-voltage switchboard, with correctly rated current clamps on all phases and the measurement point clearly documented]
Important orders combine significant current with a consequence at the selected point. Six-pulse converters commonly produce characteristic orders near 5, 7, 11, and 13, although network and load conditions alter their magnitudes. Twelve-pulse arrangements may reduce lower orders, but measurement must confirm this.
Triplen orders—3rd, 9th, 15th, and so on—are zero-sequence components in many three-phase four-wire systems. They can add in the neutral, making phase and neutral measurements essential for line-to-neutral electronic loads. Even harmonics may indicate asymmetry, control irregularity, or measurement error.
A smaller component may still matter for an individual limit, capacitor stress, resonance, or generator operation. Conversely, a tall percentage bar at light load may represent few amperes. Review current, phase distribution, voltage harmonics, and network impedance together.
The same nonlinear load can produce different spectra at 25%, 50%, and 100% output. THDi often rises when the fundamental current falls because its denominator becomes smaller, while harmonic amperes may stay flat or decrease. Therefore, record fundamental current, total RMS current, harmonic current by order, THDi, and operating state at the same timestamp.
For network compliance, distinguish THDi from total demand distortion (TDD). TDD uses an established maximum demand current rather than the present fundamental current. The detailed relationship is explained in TDD vs THDi at the PCC. Neither metric replaces individual-order data for AHF sizing.
Use a representative logging period that captures normal production, peak combinations, low-load operation, starts, batch changes, bypass states, and generator mode where applicable. If several loads share a bus, simultaneous harmonic currents may partly cancel or reinforce because phase angles differ. Do not add separate feeder magnitudes arithmetically unless the design deliberately uses a conservative assumption and documents it.
The measurement point defines both what the spectrum contains and what equipment the correction can relieve. A load-terminal spectrum characterizes one source; a feeder spectrum captures diversity within that branch; an incomer or point-of-common-coupling (PCC) spectrum shows what flows upstream. If the acceptance point differs from the measurement point, repeat or correlate measurements rather than transferring percentages unchanged.
| Measurement location | What the spectrum represents | Best use | Main caution |
|---|---|---|---|
| Individual load terminals | One nonlinear load and its local supply conditions | Identify source signature and load-side correction duty | Does not include diversity or cancellation with other loads |
| Feeder or MCC incomer | Combined current of loads inside that feeder zone | Size feeder-level correction and assess cable or transformer loading | Parallel feeders and tie states remain outside the measurement |
| Main switchboard incomer | Net current from all downstream buses in the recorded configuration | Assess centralized correction and source-side residual current | May hide high distortion on an internal feeder |
| PCC | Current exchanged with the supplying network at the defined boundary | Evaluate contractual or utility criteria | The PCC must be formally identified; it is not always the main LV incomer |
Location also determines AHF architecture. A central unit can reduce upstream current but cannot remove harmonic current from branch conductors between each load and the common bus. See where to install an AHF for main-bus, feeder, and load-side trade-offs.
Assume a 400 V feeder is measured during its critical operating state. The fundamental current is 420 A. The analyzer records 70 A at the 5th, 38 A at the 7th, 18 A at the 11th, 14 A at the 13th, and 12 A root-sum-square across the remaining orders. These values are illustrative inputs, not a claimed project result.
The measured harmonic current is:
Ih = √(70² + 38² + 18² + 14² + 12²) = 83.8 A
Suppose the engineering target permits 35 A residual harmonic current at the same feeder point. A simple total-current difference, 83.8 − 35 = 48.8 A, is not yet a sufficient rating because compensation must be allocated across orders. If the target is translated into provisional residuals of 20 A at the 5th, 15 A at the 7th, 10 A at the 11th, 8 A at the 13th, and 8 A for the remainder, the required compensation by order is 50, 23, 8, 6, and 4 A.
| Component | Measured current | Provisional residual | Compensation current |
|---|---|---|---|
| 5th | 70 A | 20 A | 50 A |
| 7th | 38 A | 15 A | 23 A |
| 11th | 18 A | 10 A | 8 A |
| 13th | 14 A | 8 A | 6 A |
| Remaining RSS | 12 A | 8 A | 4 A |
The root-sum-square of those compensation components is about 56 A. That is a preliminary harmonic duty, not the final nameplate rating. The next step is to test time-series variation and phase imbalance, then apply documented allowances for CT error, ambient temperature, altitude, voltage, future loads, and reactive or negative-sequence compensation. Also confirm that the AHF supports the required orders and can maintain the target when its current limit is reached. If the spectrum is stable and concentrated in one order, compare the AHF with passive or hybrid options using the active versus passive harmonic filter guide.
Export per-phase harmonic magnitudes in amperes with timestamps, fundamental current, voltage data, meter settings, CT ratios, and event or trend files in a nonproprietary format where possible. Include the single-line diagram and an operating log so reviewers can reconstruct the measurement context.
Only after checking harmonic grouping, aggregation intervals, displayed units, phase treatment, measurement bandwidth, and accuracy class. Two instruments can produce apparently different bars from the same waveform if their calculation or averaging settings differ.
Request them when combining multiple sources, studying cancellation, validating models, or planning several compensation devices. Magnitudes alone are usually adequate for initial screening, but phase relationships improve estimates of the net current at a common bus.
Once you know how to read a harmonic spectrum, prepare a data package containing the single-line diagram, exact measurement locations, per-phase spectra in amperes, fundamental and RMS current trends, voltage harmonics, operating states, transformer and generator data, existing capacitors, CT requirements, ambient conditions, expansion plans, and the residual target at a named point. Elumotive can then review whether centralized, feeder-level, load-side, passive, or hybrid mitigation is technically appropriate. The purpose of the review is to define assumptions and a testable specification—not to promise a result from incomplete measurements.


Leave a Comment