
A power quality report can contain dozens of charts and hundreds of measured values. The decision-maker rarely needs every number. The practical task is to identify which readings show a real operating risk, which values change with production and which correction technology matches the problem.
Before interpreting a result, confirm the measurement point, recording period and operating condition. A reading at one VFD describes that load. A reading at the main low-voltage bus describes the combined plant. A reading at the point of common coupling may be used for system-level assessment. Record whether the plant was at light load, normal production or peak demand.
| Metric | What it tells you | Typical next question |
|---|---|---|
| THDi | Current waveform distortion relative to the fundamental | Which loads and harmonic orders create it? |
| THDv | Voltage waveform distortion at the measurement point | Is the distortion local or visible at the PCC? |
| Power factor | How effectively current produces useful power | Is the low value caused by reactive power, distortion or both? |
| kVAR | Reactive-power demand | Is demand steady, step-changing or phase-unbalanced? |
| Voltage/current unbalance | Difference between phases | Are single-phase loads or network conditions responsible? |
Total distortion is a summary. The individual spectrum indicates the source. Six-pulse converters often produce characteristic fifth and seventh harmonics. Single-phase electronic loads can create triplen harmonics and high neutral current. The mitigation design should use measured harmonic amperes by order because an AHF is selected by compensation current, not by THDi percentage alone.
For the basic difference between the two distortion values, read THDi vs THDv. The industrial power quality audit checklist provides a useful measurement plan.
A single screenshot can miss the event that causes alarms or penalties. Compare demand, power factor, THDi, THDv and unbalance on the same time axis. If kVAR changes quickly while harmonic current remains stable, dynamic reactive compensation may be the priority. If harmonic amperes rise with VFD loading, an AHF may be required. If both move together, a coordinated AHF and SVG solution may be more economical.
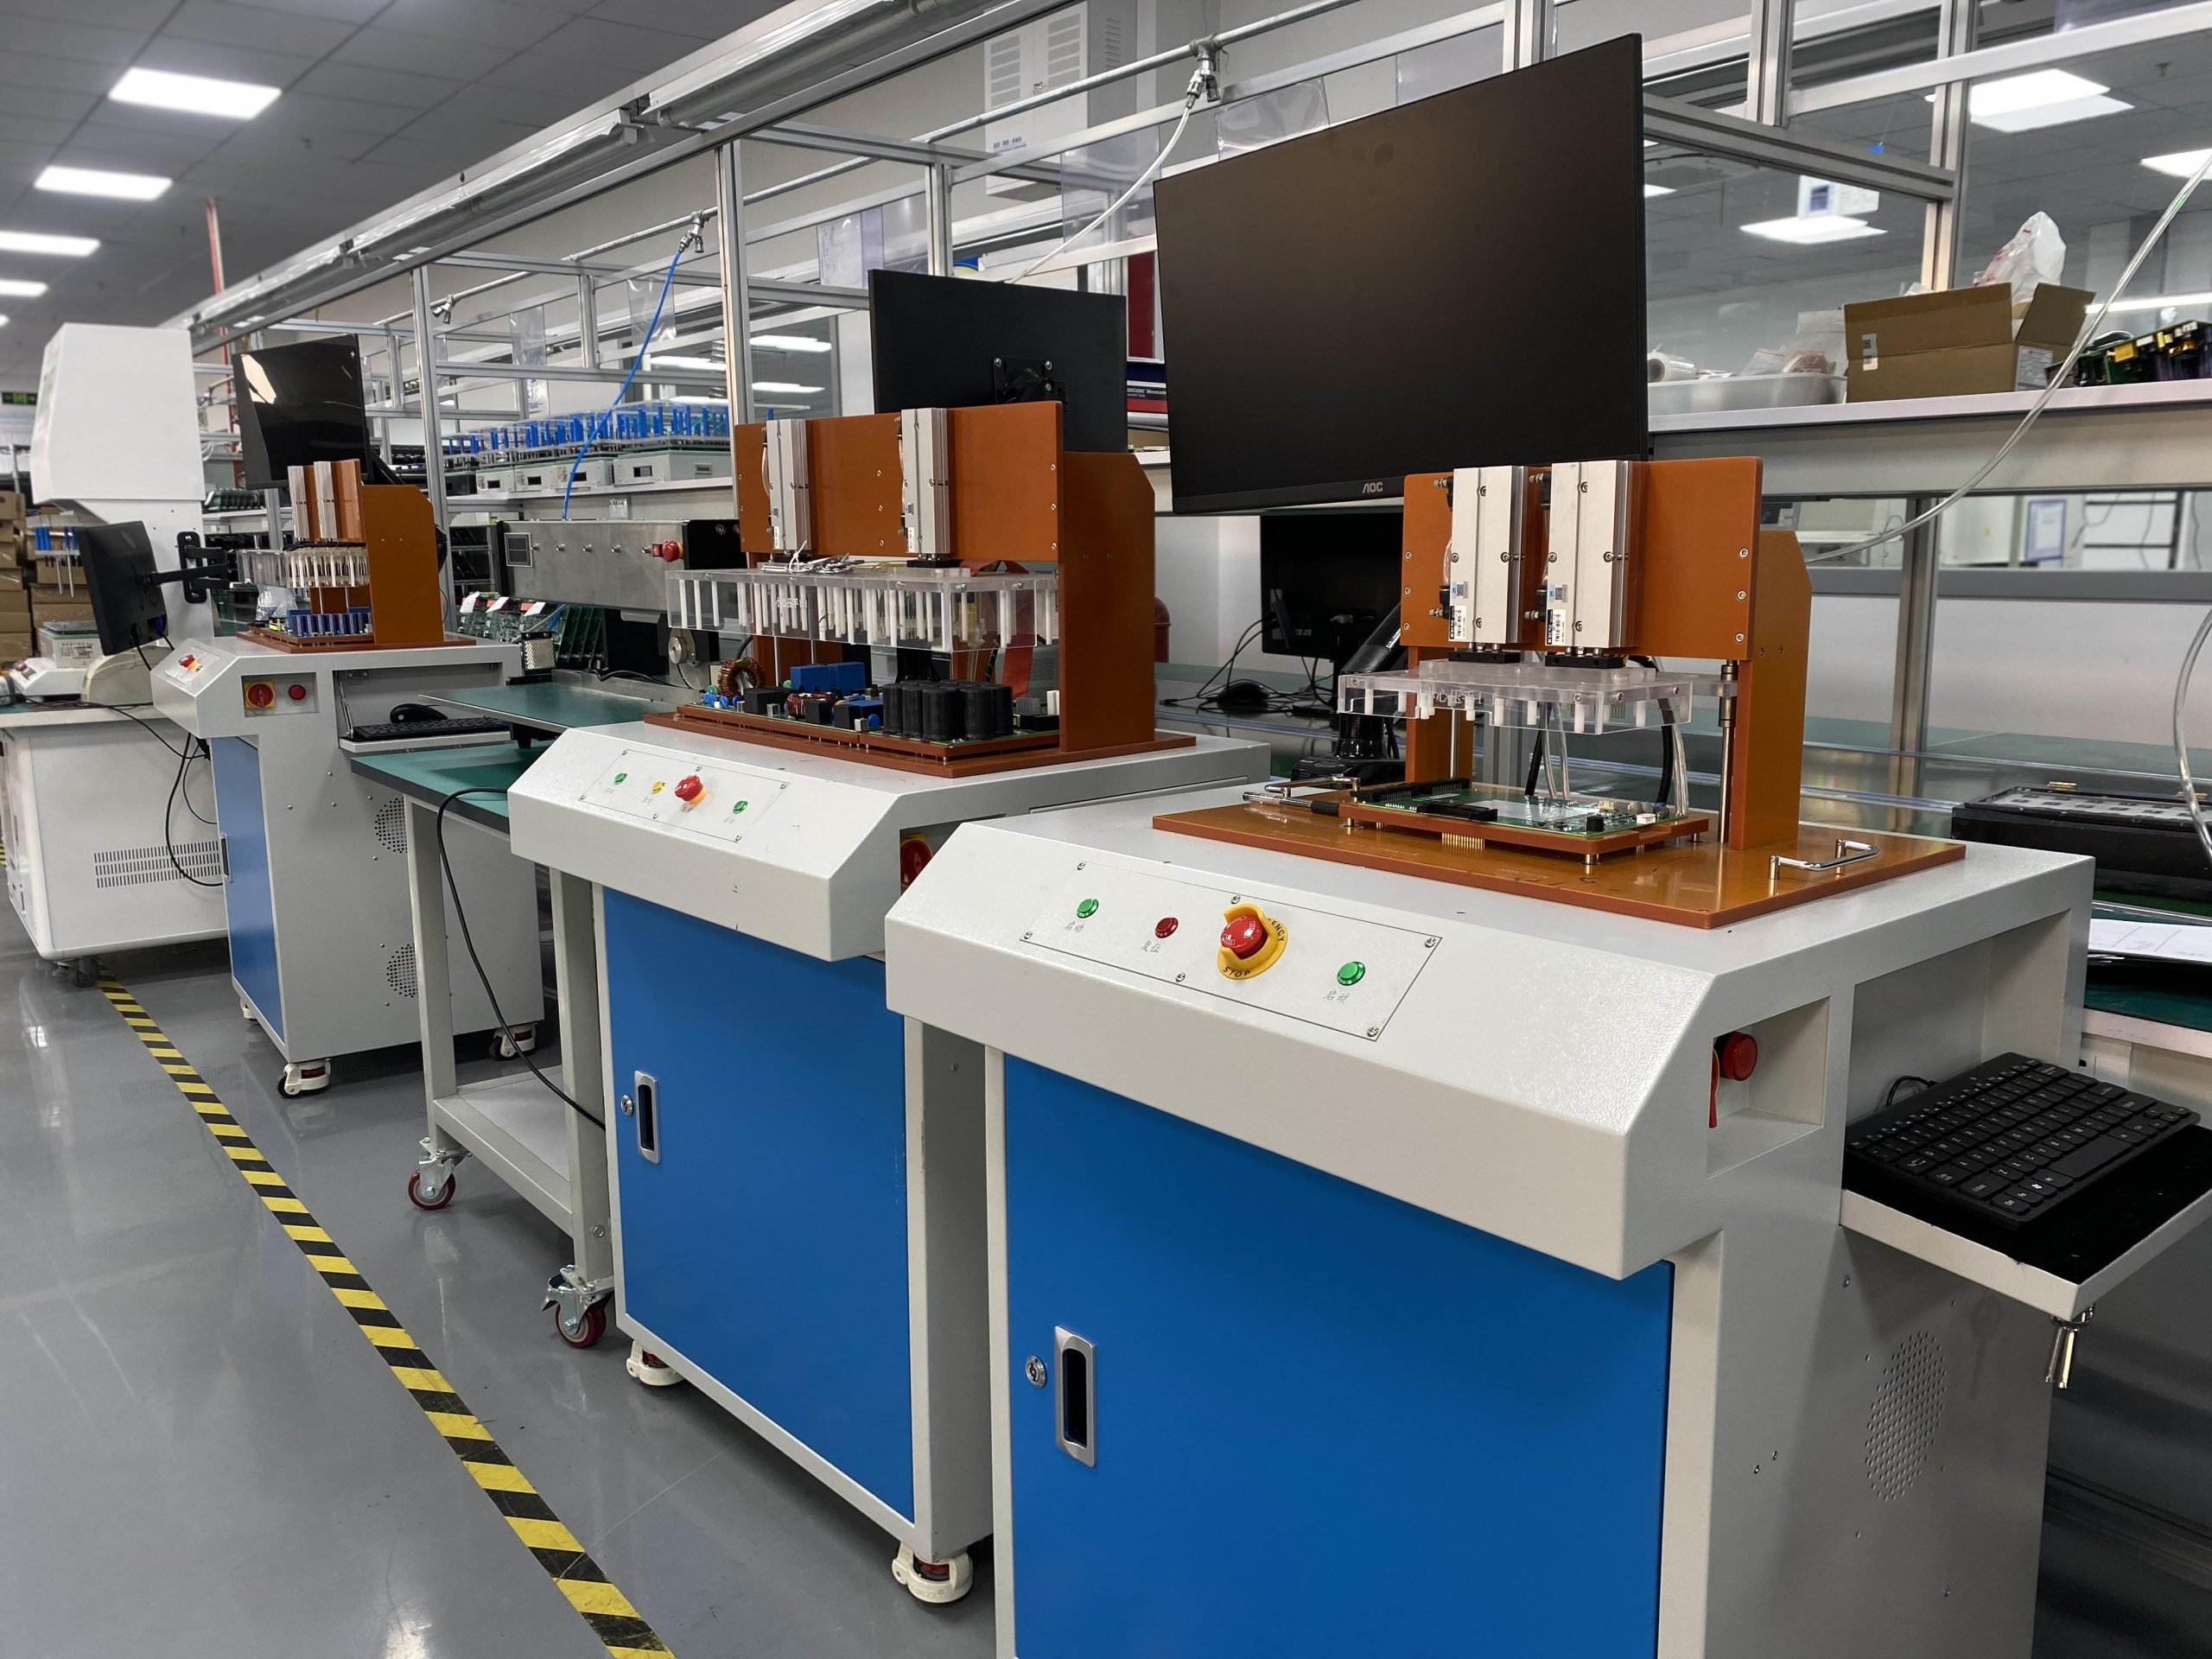
A useful power quality report should connect each measured value to an operating condition and a decision. Check whether alarms coincide with production shifts, generator operation or large load changes. Compare at least one normal period with the worst repeatable event, and keep the original analyzer export for engineering review. When a power quality report will be used for equipment sizing, include transformer impedance, feeder arrangement, maximum demand and planned expansion. These details help the engineer separate harmonic filtering, reactive compensation and phase-balancing requirements before selecting equipment.
It can identify an obvious issue, but a variable plant normally needs a longer recording period covering representative production states.
No. Rapidly changing demand may favor an SVG, and heavy harmonics may require detuning or active filtering before capacitors are added.
Send the single-line diagram, transformer data, analyzer export, load list and expected expansion. Elumotive can organize the data into an initial AHF, SVG or hybrid concept. Contact the engineering team for review.